How to use Get-StoreUsageStatistics in Powershell

Managing an Exchange Server requires closely monitoring performance metrics to ensure everything runs smoothly.
The Get-StoreUsageStatistics cmdlet in ExchangePowerShell is a powerful tool that helps you monitor resource usage on your mailboxes, databases and servers. In this guide, we'll show you how to use the cmdlet to get detailed insights and improve your server's performance in 3 easy steps.
What is the Get-StoreUsageStatistics PowerShell Cmdlet?
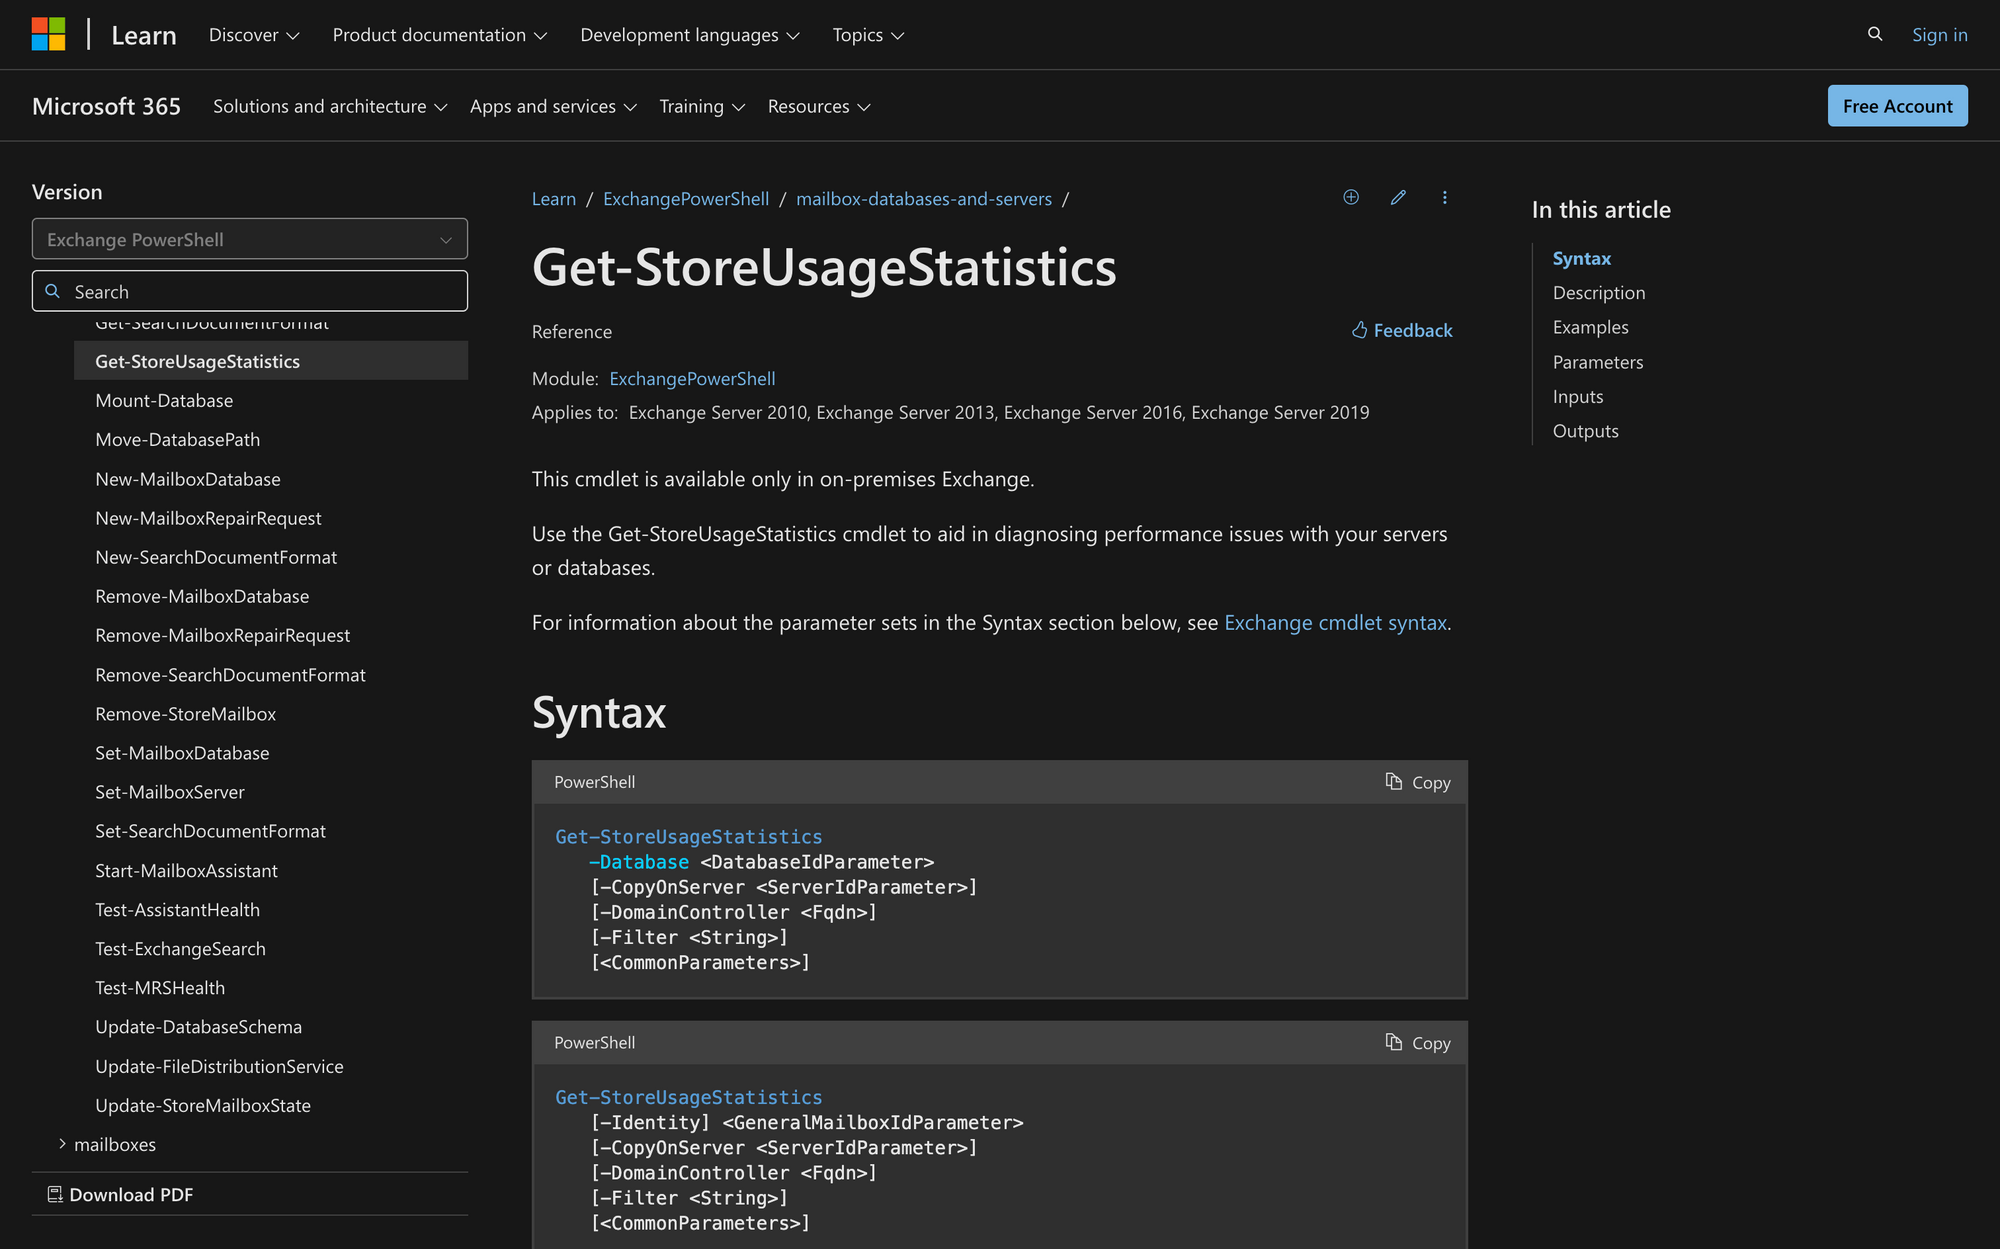
The Get-StoreUsageStatistics cmdlet in ExchangePowerShell is a tool used to diagnose performance issues in on-premises Exchange Server environments (versions 2010-2019).
It provides detailed usage data for mailboxes on servers or databases, such as latency, input/output, page counts, and processor usage. The cmdlet helps identify the top 25 mailboxes using the most resources over specific intervals, offering insights into server load and potential bottlenecks.
Here’s the syntax of Get-StoreUsageStatistics - check it out to learn more about the parameters that make this command work efficiently:
3 Practical Use Cases for the Get-StoreUsageStatistics Cmdlet in ExchangePowerShell
Here are three common scenarios where this cmdlet proves its value:
- Identifying Resource-Intensive Mailboxes: When server performance dips, administrators can use this cmdlet to quickly pinpoint mailboxes consuming the most resources. By retrieving the top 25 mailboxes based on metrics like TimeInServer and processor usage, they can identify heavy users and take corrective actions, such as optimizing mailbox usage or redistributing workloads.
- Diagnosing Database Performance Bottlenecks: This cmdlet can analyze a specific database's usage statistics, highlighting mailboxes with high I/O or latency issues. For example, if a database experiences frequent slowdowns, running Get-StoreUsageStatistics helps isolate problem mailboxes and determine if additional storage or server resources are needed.
- Monitoring Server Load Over Time: For servers hosting multiple active and passive database copies, the cmdlet provides a snapshot of usage patterns. Administrators can include passive copies in the analysis to understand the overall impact of database replication and plan better resource allocation to maintain high availability.
Prerequisites for Using the Get-StoreUsageStatistics Cmdlet
To use the Get-StoreUsageStatistics cmdlet effectively in Exchange Server, the following prerequisites are met:
- On-Premises Exchange Environment: This cmdlet is available only for on-premises Exchange Server versions 2010, 2013, 2016 and 2019. It’s not supported in Exchange Online or hybrid deployments.
- Permissions: You need the appropriate permissions assigned to run the cmdlet and access the required parameters. Permission levels can vary depending on the organization’s configuration.
- Database or Server Identifiers: You must specify either the database, server, or mailbox identity to retrieve statistics. Identifiers can include database names, GUIDs, distinguished names (DNs), or fully qualified domain names (FQDNs).
How to Use the Get-StoreUsageStatistics Cmdlet in Exchange PowerShell
Now, let’s learn how to use the Get-StoreUsageStatistics command in just three steps.
First, make sure to connect to Exchange PowerShell. Then, move on to the first step in this guide.
Step 1: Understanding the Cmdlet and Key Parameters
To use Get-StoreUsageStatistics, you need to understand the different parameters that help you narrow down the data you want to retrieve.
So, for instance, if you're interested in statistics from a specific mailbox database, use this parameter. For example, if you have a database named "Meeting Room Database", you can get the store usage statistics like this:
On the other hand, if you want statistics from a particular server, use the -Server parameter. Let’s say your server is called Meeting Room Server, and you want statistics from that specific server:
If you're looking for statistics on a specific mailbox, use the -Identity parameter. For this example, we’ll use the mailbox [email protected]:
This command retrieves resource usage statistics for the mailbox [email protected], focusing on metrics like I/O, CPU usage, and time spent in the mailbox store.
You can also use the -Filter parameter to search for specific properties or values in the data. For example, if you want to filter results to show only users who have a high number of log record bytes, you can apply a filter like this:
Step 2: Running the Get-Store-UsageStatistics Cmdlet
Now that you know what parameters to use, let’s run the cmdlet with a focus on a specific mailbox, [email protected], to gather store usage statistics.
First, let’s retrieve the statistics for the mailbox on a specific server, EX1:
This will pull up the store usage statistics for [email protected] and display the results in a formatted table (ft -auto).
Step 3: Interpret the Results
The results include several key metrics, and here’s how to interpret them:
- TimeInServer: This indicates how long requests for the mailbox spent in the Microsoft Exchange Information Store. High values here suggest that the mailbox is placing a heavy load on the server.
- LogRecordBytes: This shows the number of bytes associated with log records for the mailbox. If this number is too high, it could indicate that the mailbox is being heavily accessed or that there are many changes being made to it.
- I/O Operations: This metric tells you how many read/write operations were performed for the mailbox. If the number is high, it could indicate a performance issue requiring optimization.
Managing and Using Get-StoreUsageStatistics in PowerShell Like a Pro
The Get-StoreUsageStatistics cmdlet is a vital tool for monitoring and improving Exchange Server performance. Let’s wrap up what you can do with this command:
- Retrieve detailed statistics on resource usage across mailboxes, databases and servers.
- Help identify performance bottlenecks, such as high I/O or server load on specific mailboxes.
- Provide actionable insights to optimize server efficiency and ensure smoother operation.
If you encounter issues when running the cmdlet, make sure to verify your permissions and ensure the correct server or database is specified, as these are common stumbling blocks for successful execution.